Profit Per Acre: The Number That Tells You Which Fields Are Paying the Bills
A whole-farm P&L can look fine while a third of your acres quietly lose money. Here's how to actually compute profit per acre — field by field, with realized prices and land cost in — the three places the math usually goes wrong, and what to do once you can finally see it.

The farm made money. Did every field?
Most operations I work with can tell me, within a few thousand dollars, whether the farm made money last year. The tax return says so. The lender's spreadsheet says so. What far fewer can tell me is which fields made that money — and which ones rode along for free.
That distinction isn't academic. On a thin-margin year, a whole-farm number that comes out slightly positive is very often the sum of a handful of fields that did well and a handful that lost money on every acre. Average them together and the loss disappears into the average. It doesn't disappear from your checkbook. It just stops being visible.
Profit per acre, computed field by field, is the number that makes it visible again. It's not complicated math. The reason most farms don't have it isn't that it's hard to understand — it's that it's tedious to assemble by hand, and the places it goes wrong are subtle enough that a lot of the "per-acre" numbers I see are quietly wrong.
So let me walk through what the number actually is, where the math breaks, and what it's good for once you have it.
The formula, and why "per acre" isn't one number
At its simplest:
Profit per acre = revenue per acre − cost per acre.
The trouble starts the moment you ask which costs. There are really three profit-per-acre numbers, and they answer different questions.
Operating margin per acre is revenue minus direct inputs — seed, fertilizer, chemicals, crop insurance, drying, trucking, custom work. This tells you whether the crop itself paid for the stuff you put into it. It's the number that matters for in-season decisions: a fungicide pass, an extra nitrogen application, whether to spray.
Return after land cost subtracts what the ground costs you. If it's rented, that's your cash rent or your share. If you own it, it's still not free — it's the rent you could have collected, or the payment and taxes you're carrying. This is the number that tells you whether a particular piece of ground is worth farming at the terms you're farming it on.
Return after overhead subtracts the rest: machinery depreciation and repairs, labor, insurance on the equipment, interest, management. This is the one that reconciles back to your actual bottom line.
A field can look great on operating margin and lose money after rent. That's not a contradiction. That's the whole point of keeping the three numbers separate instead of blending them. When someone tells me a field "makes $200 an acre," my first question is always: before or after rent?
Where the math goes wrong
Three places, in rough order of how often I see them.
Budget prices instead of realized prices
The revenue side gets built from a projected price — the number on the budget sheet in January. But you didn't sell at that number. You sold some in the spring, some off the combine, some out of the bin in February, each at a different futures price and a different basis. Realized revenue per acre is what you were actually paid, divided by the acres that produced it. If you use budget prices, you're measuring the crop you hoped for, not the one you sold.
This is also where basis quietly costs people. A twenty-cent basis swing on 200-bushel corn is $40 an acre. It's real money, and it belongs in the per-field math, not in a footnote.
Forgetting the land cost — or using the wrong one
Owned ground gets treated as free, which makes every field on it look like a winner and masks the fact that you'd have been better off renting it out some years. Rented ground gets a single blended rent applied across the farm, which hides the fact that your $350 ground and your $225 ground are not the same business.
Use the actual rent for each rented parcel. Put an honest opportunity cost on the owned acres. Yes, it makes the owned ground look worse. It's supposed to. You're trying to find out what's true.
Averaging across fields
This is the big one, and it's the mistake that comes from doing the math at the farm level instead of the field level. Allocate costs by field — the seed that went on that field, the fertilizer rate that field got, the rent for that parcel — and then look at the spread. The spread is the information. A farm averaging $60 an acre after rent might be a $150 field, a $95 field, a $25 field, and a field losing $30 an acre. The average told you none of that.
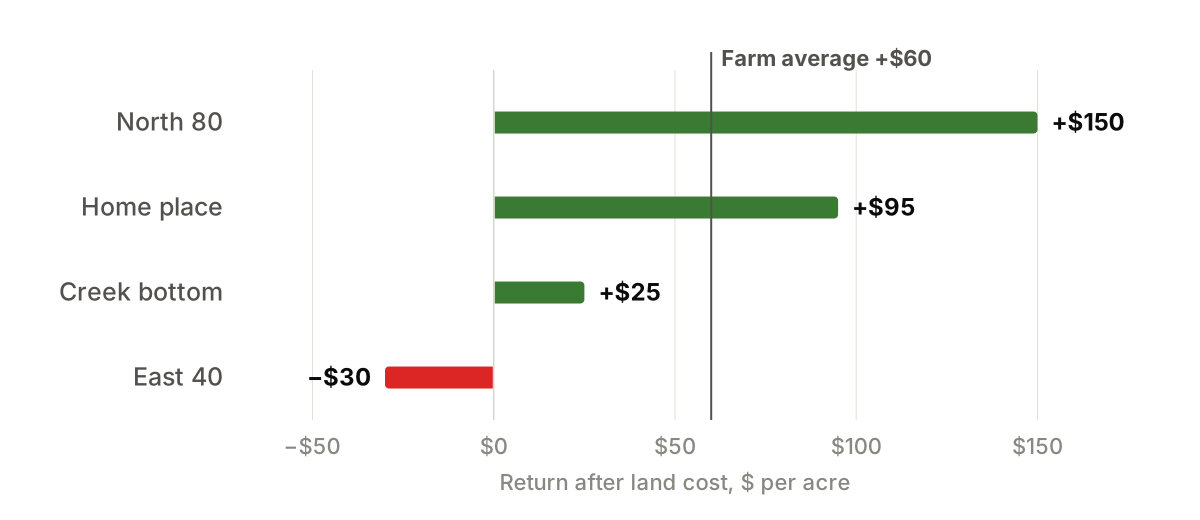
Four fields, one farm, illustrative numbers. The farm "averages" +$60 an acre after land cost — and East 40 loses $30 on every acre inside that average.
A worked example (illustrative numbers)
Let me make it concrete. The numbers below are round and illustrative, not a forecast. Two fields on the same farm, same hybrid, same inputs per acre, same realized price of $4.20 a bushel.
Field A yields 205 bushels. Revenue is about $861 an acre. Direct inputs run $520. Operating margin: $341. Cash rent on this parcel is $300. Return after rent: about +$41 an acre.
Field B yields 168 bushels — tighter soil, a wet spot that drowned out, whatever the story is. Revenue is about $706. Same $520 in inputs. Operating margin: $186. This parcel also rents for $300. Return after rent: about −$114 an acre.
Now average the two fields. The farm shows roughly a $36-an-acre loss after rent, and your instinct is "corn didn't pencil this year." But that isn't what happened. Field A penciled fine. Field B lost $114 on every acre, and it's been doing some version of that for a while — you just couldn't see it because it was blended in with A.
Notice also what the three numbers tell you separately. Both fields covered their inputs — the crop paid for the seed and fertilizer on B. What B didn't cover was the rent. That's not an agronomy problem you fix with a better fungicide. That's a lease problem.
Here's Field A again, laid out as the three margins — with an illustrative $30 an acre of overhead layered on at the end so you can see all three steps:
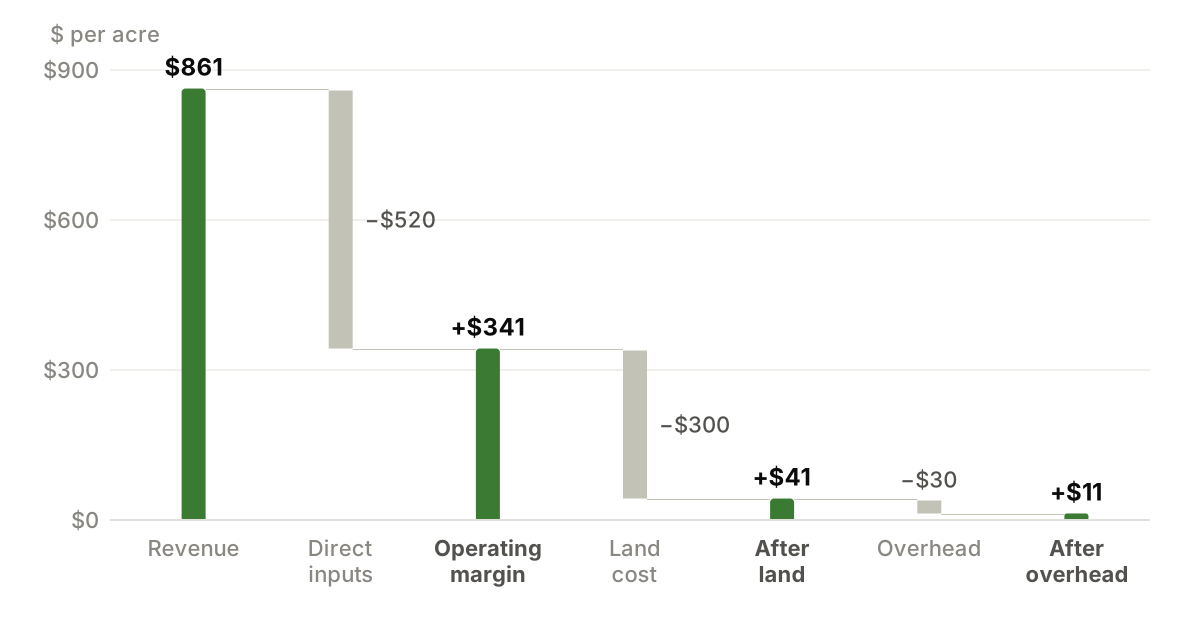
The same field, three different answers to "did it make money?" Which one you look at depends on the decision in front of you. Overhead is illustrative.
Run your own fields
The quickest way to feel this is to plug in your own numbers. The two fields below start with the example above — change any value and watch the three margins, each field's breakeven, and the acre-weighted farm average move.
Run your own fields
Change any number. The two fields start with the worked example above. Everything is per acre; the farm line is acre-weighted — the average that hides the spread.
- Operating margin
- +$341
- Return after land
- +$41
- Return after overhead
- +$11
At today's $4.20 bid, these bushels are above water by $0.20 / bu on inputs + land.
- Operating margin
- +$186
- Return after land
- −$114
- Return after overhead
- −$144
At today's $4.20 bid, these bushels are under water by $0.68 / bu on inputs + land.
Whole farm (160 acres, acre-weighted)
−$5,872 total after land- Operating margin
- +$263 / ac
- Return after land
- −$37 / ac
- Return after overhead
- −$67 / ac
If the farm line is positive while one field is negative, that field is being carried by the other — the average hides it. Illustrative math; not a forecast.
Why this is so hard to assemble by hand
If the math is simple, why doesn't everyone have it?
Because the data lives in six places and you're the integration layer. The fertilizer invoice came as one bulk delivery across four fields and nobody split it. The scale tickets are in a folder in the truck. The cash rent is in a lease agreement in a filing cabinet. The custom application bill doesn't say which fields. The realized price is scattered across a dozen settlement sheets. And the field boundaries and acres live in the planter monitor.
To get a true per-field number, every one of those has to be tagged to a field, a crop, and a year at the point it comes in — not reconstructed in March from memory. That's the part that's tedious, and tedious is why it doesn't get done. It's not a knowledge gap. It's an hours-in-the-day gap, and most of those hours are in-season when you're the one running the planter.
How to actually track it
If you want this number and you're building it yourself, here's the discipline that makes it work.
Tag every expense to a field, crop, and year when it's entered. Not later. A bulk fertilizer invoice gets split by the rate each field received. Custom work gets allocated to the acres it covered. If it can't be tied to a field, it's overhead — put it in the overhead bucket and allocate it by acres at the end.
Use scale tickets and settlement sheets for revenue, not the budget. Every ticket carries a field (or can be assigned one), a net weight, and eventually a price. That's your realized revenue, field by field.
Carry land cost per parcel, not per farm. The actual rent for each rented piece; an honest opportunity cost on owned ground.
Review by field, every year, and keep the history. One year is a data point, not a verdict — a wet spring can sink a good field. Three years is a pattern. Rotation matters too: a soybean year on a field will look different from a corn year, so compare like to like.
Keep the three margins separate. Operating margin for in-season calls. Return after land for lease decisions. Return after overhead to tie out to the books.
What you do with it once you can see it
This is the part that pays for the effort.
Lease renewals. Field B above isn't a field you quit farming necessarily — it might be a field you renegotiate. Walking into a rent conversation with three years of per-acre returns on that specific parcel is a very different conversation from "rents seem high."
Where to spend and where to stop spending. The field with a $140 after-rent return can justify variable-rate seed, a tissue test, a second fungicide pass. The field losing $45 an acre probably shouldn't get the premium hybrid. Inputs should follow the margin.
Your breakeven, by field, for marketing. Run the example above backwards: Field A needs about $4.00 a bushel to cover its inputs and rent, and Field B needs about $4.88. At a $4.20 bid, A's bushels are above water and B's aren't — so you know which bushels you can afford to sell today and which you're selling at a loss. Breakeven is a per-field number pretending to be a farm number.
Expansion decisions. When a piece of ground comes available, you'll have a real basis for what you can pay for it — your own fields' returns, not a county average.
Put the assistant to work on it
Once the books are tagged by field, the per-acre number stops being the end of the exercise and becomes the start of a better one: asking what to change next year, with your own data doing the talking.
This is where I think the AI side of Clevis earns its keep, and I want to be precise about what it does, because "AI" gets waved at a lot of farm software. The assistant doesn't guess at your farm. When you ask it a question about money, it runs the math against your actual records — the tagged expenses, the scale tickets, the rent on each parcel — and it shows you the numbers it used. A few things I actually ask it in the off-season:
"Which fields had the thinnest return after rent this year?" It ranks your fields by income minus the expenses allocated to them, so the Field B in your operation shows up by name instead of hiding in the average.
"What did I spend per acre on fertilizer, seed, and chemicals, and how does that compare to last year?" It breaks cost per acre out by category from the invoices you've already tagged — no re-keying — so you can see whether the number that grew is the one you meant to grow.
"If I'd skipped the second fungicide pass on the fields that lost money, what would it have saved?" It pulls the application records and their cost on those specific fields and gives you the figure next to what those fields yielded, so the saving is weighed against the bushels.
"The Johnson 80 is coming open. If I pick it up at $275 for corn, how does it pencil?" This one models the addition on your own cost of production, your yield history, and your equipment capacity — marginal profit per acre, the breakeven price and yield, what it does to your fixed cost spread over more acres, and whether the planter can cover the extra ground in the window. Your numbers, not a county budget.
"At today's bids, which of my unpriced bushels are above breakeven?" It knows each field's breakeven from the books and the cash bids at the elevators near you, so the answer comes back field by field — which bushels you can afford to sell this week and which you'd be selling at a loss.
Here's roughly what that conversation looks like, using the illustrative farm from the chart above:
You: Which fields are under water after rent this year, and what would it take to get them back above it?
Clevis: On 2026 books so far, one of your four fields is under water after rent. East 40 is at −$30/ac: 188 bu/ac at a $4.20 realized average ($790/ac), $520/ac in allocated inputs, $300/ac rent — about −$1,200 on the field. To break even after rent it needs either $0.16 more per bushel or about 7 more bushels an acre at today's price. Its chemical spend was $61/ac against a farm average of $44 — the two fungicide passes are most of that gap. The other three fields are positive: North 80 +$150, Home place +$95, Creek bottom +$25. These figures exclude 4,100 unpriced bushels still in storage. Want me to run the East 40 at one fungicide pass, or look at what the lease would need to be?
Illustrative exchange — the numbers are the article's example, not a real farm.
Ask it where next year's money could come from and it will go looking in the same places you would — fields under water after rent, input categories that climbed faster than yield, repair bills on a machine that has become a line item of its own, a lease priced for a yield the field doesn't make — and it will put a dollar figure on each one from your records, with the assumptions stated so you can argue with them.
What it won't do is decide. It doesn't change a lease, cut an input, or move a dollar in your books on its own. It lays out the options and the math, and the decision stays at your kitchen table where it belongs. And it's only as sharp as the records behind it — the same rule as everything else in this piece. The fields and years you've tagged well are the ones it can speak to well.
What it is not
Profit per acre isn't a verdict on you as a farmer, and it isn't a reason to farm the spreadsheet instead of the ground. A losing field can be a rotation year, a drowned-out spring, a lease you're holding for strategic reasons. The number doesn't tell you what to do. It tells you what's true, so that whatever you decide, you decide it with your eyes open.
It's also only as honest as the data behind it. Guessed allocations produce confident, wrong numbers. If you can't tie a cost to a field, say so and put it in overhead — a real "I don't know" beats a fake precision.
Where Clevis fits
This is one of the reasons I built the accounting the way I did. Receipts and invoices get tagged to a field, crop, and year as they come in — snap the receipt, confirm the split, done. Scale tickets post the delivery and the income against the right field without re-keying. Rent sits with the parcel. And because the books share context with your agronomy and your marketing, the per-acre number isn't a report you build in March; it's a view you can pull up in July when you're deciding whether the fungicide pass is worth it on this field.
It won't make a bad lease a good one. What it does is take the assembly work off your plate so the number exists at all — which, for most mid-size operations, is the whole problem — and then put an assistant on top of it that can answer the next question from the same books.
Who this is for
The same operator I keep building for: the farmer who is his own accounting department. If you've got a controller turning your ledger into field-level answers, you already have this. If that person is you, at the kitchen table in the off-season, then knowing your profit per acre by field — rather than meaning to get to it — is the difference between managing your acres and averaging them.
If you farm corn or soybeans in the Midwest and you'd like to see your own operation broken down by the acre instead of by the account, the morning brief is a fine place to start. It's free, it's farmer-up, and it doesn't ask you to move a thing until you're ready.
Keep reading
- Accounting · 7 min read
Farm Accounting vs. QuickBooks: Why Your Books Should Know Your Fields
QuickBooks can tell you the farm made money. It can't tell you which fields made it. Here's the honest case for farm-native accounting — books that are organized by field, crop, and bushel instead of by generic ledger account — and how you can keep QuickBooks for what it's good at while you make the switch.
Read - Agronomy · 8 min read
In-Season Corn Decisions: The Calls That Make or Break the Crop
Corn makes its yield in a handful of narrow windows between emergence and grain fill — and most of those decisions get made in the truck, between everything else. Here's the in-season decision sequence that actually moves yield, and how an AI advisor grounded in your fields helps you catch each window on time.
Read - Marketing · 5 min read
Farm Marketing AI: How an AI Advisor Changes the Grain-Marketing Workflow
Grain marketing is where a year's profit is made or lost — and the task farmers most often run out of time for. Here's how an AI farm advisor rebuilds the marketing workflow around your operation, step by step.
Read - Marketing · 4 min read
Can AI Predict Corn Basis? An Honest Answer
Short answer: no — not precisely, and be careful with anyone who says otherwise. Here's what basis actually is, why it's so hard to forecast, and what an AI farm advisor can genuinely do to sharpen your basis decisions.
Read