How Clevis Builds a Prescription: Scripting by Profit, Not Just Yield
A variable-rate script is only as good as the thinking behind it. Here's how Clevis turns your own yield and profitability data into a prescription your planter can run — and why we rate every zone by what it returns.


Walk any field at harvest and you already know the truth: it isn't one field. It's a strong end, a tired end, a wet corner, and a knob that burns up in July. Yet on most operations the inputs still go on flat — the same rate, fence to fence. That flat rate overspends the weak ground and shortchanges the strong ground, every pass, every season.
A prescription — a "script" — is how you stop doing that. It's a map that tells your planter or applicator how much to put down in each part of the field. The idea isn't new. The hard part has always been building a script you actually trust. Here's how we build ours, and where our approach is different.
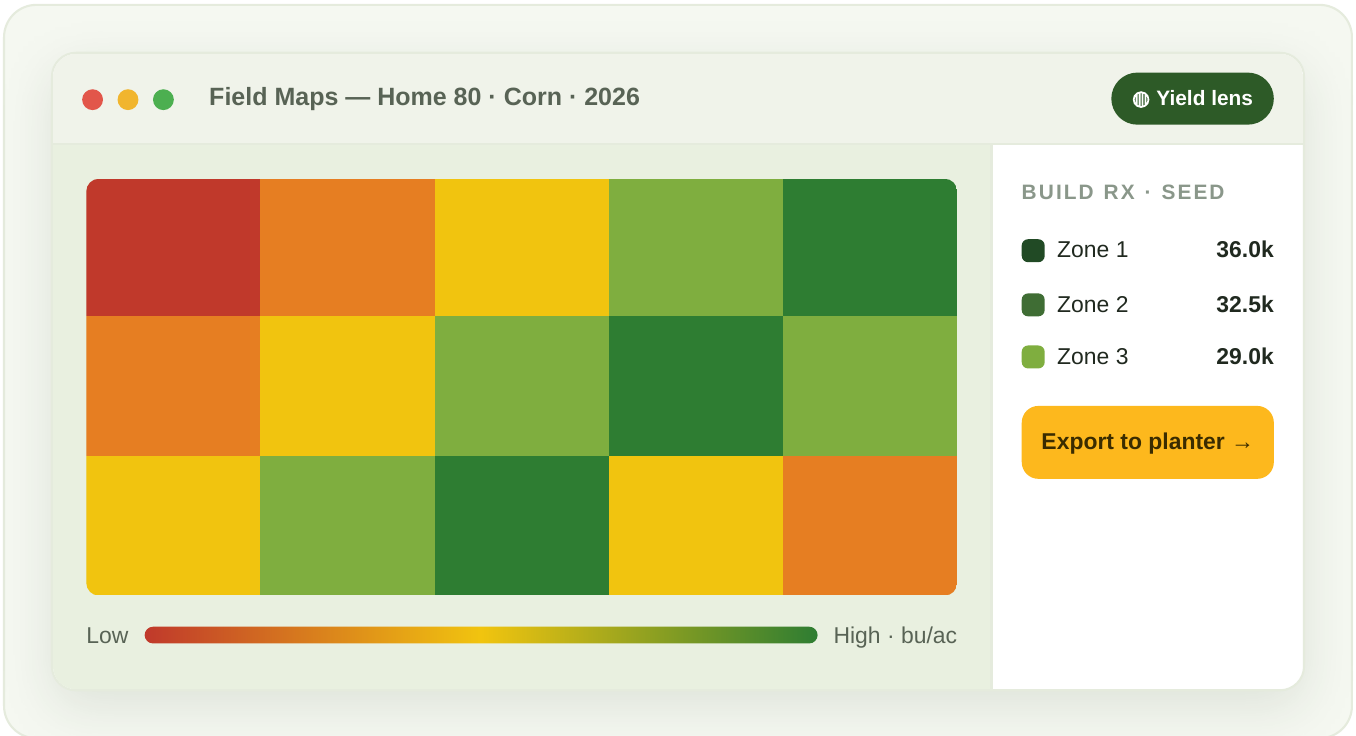
Simulated view — a corn seeding prescription built from the field's yield history. Rates shown are illustrative.
What a prescription really is
At its simplest, a prescription is two things: zones and a rate for each zone. The zones divide the field into areas that behave alike. The rate says how much seed, nitrogen, or other input each zone should get. Load that file into the monitor and the machine changes rate on the go as it crosses each boundary — no one riding the rate switch. Good scripts start with good zones, and good zones start with your own data.
Step 1 — Start with your own ground truth
We don't guess your field from a single satellite pass. We build on the layers that describe how it actually performs: years of yield history, as-applied and planting records, soil tests, elevation and drainage, and in-season imagery. Stacked together, these layers tell a consistent story about where the field is strong, where it struggles, and why.
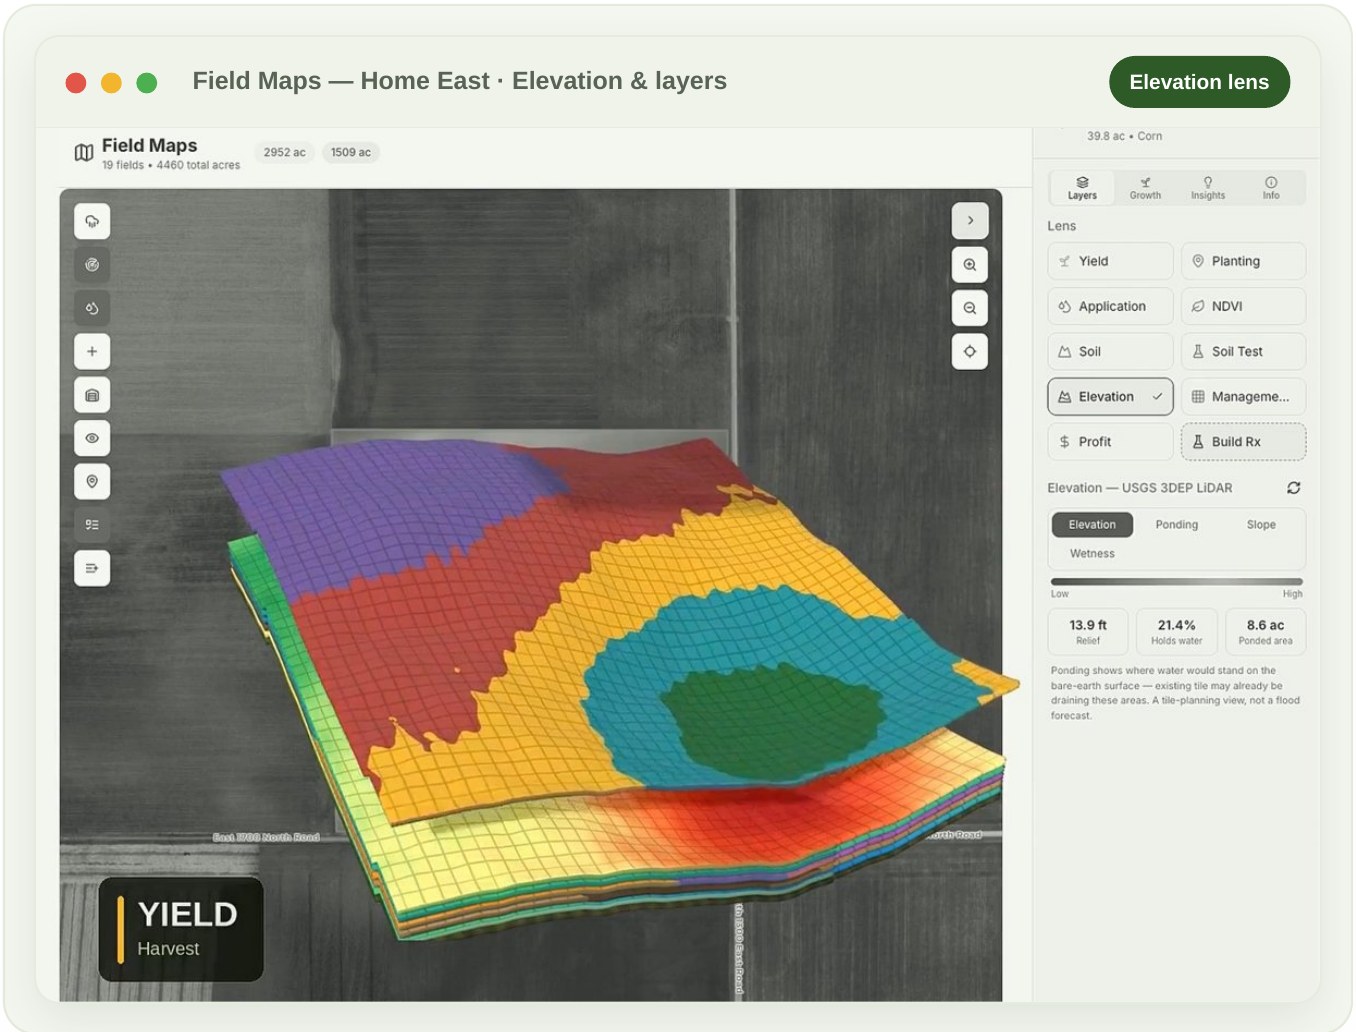
A real field in Clevis — years of data stacked into one view: elevation and LiDAR-derived zones, with relief, water-holding, and ponded acres called out on the right.
Step 2 — Turn layers into stable zones
A single wet year or one hot August can lie to you. So we lean on multi-year yield and the physical drivers — soil and topography — to draw zones that hold up season to season, rather than zones that chase last year's weather. The result is a handful of management zones that represent the real, repeatable behavior of the field.
Your best-yielding acre and your most profitable acre aren't always the same one.
Step 3 — Rate by return, not just yield
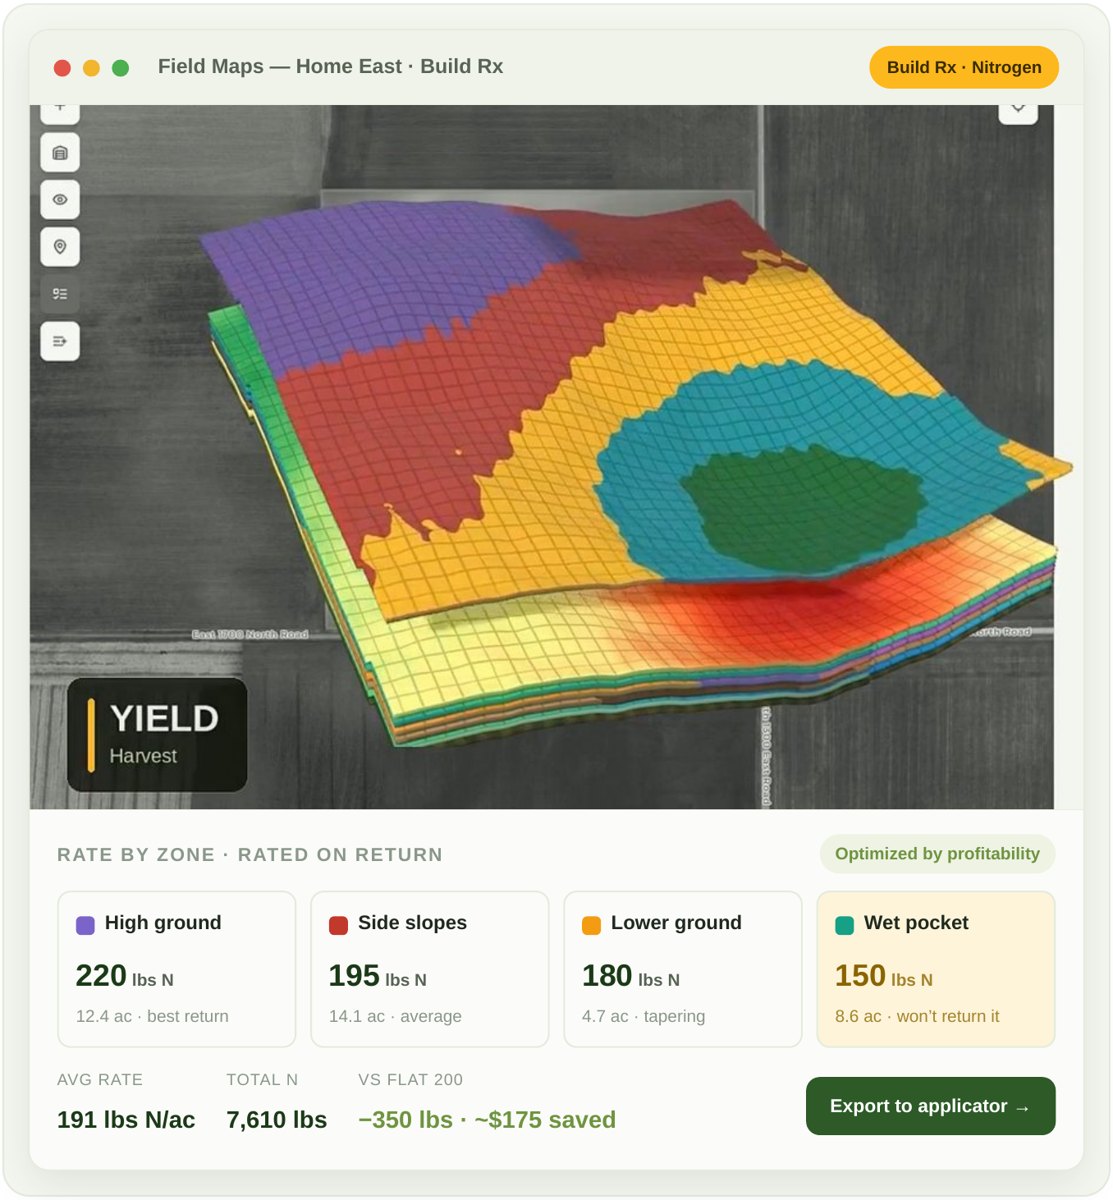
This is where most scripts stop short. They rate by yield: more bushels, more input. But the goal isn't maximum yield — it's maximum return. So we bring profitability into the zone: what each area yields, what it costs to farm, and what it actually pays back. Then we set discrete, grid-aligned rate breaks — push the productive ground that returns the investment, and pull back where you'd be spending into ground that won't pay it back. Fewer dollars chasing bushels that never show up at the scale.
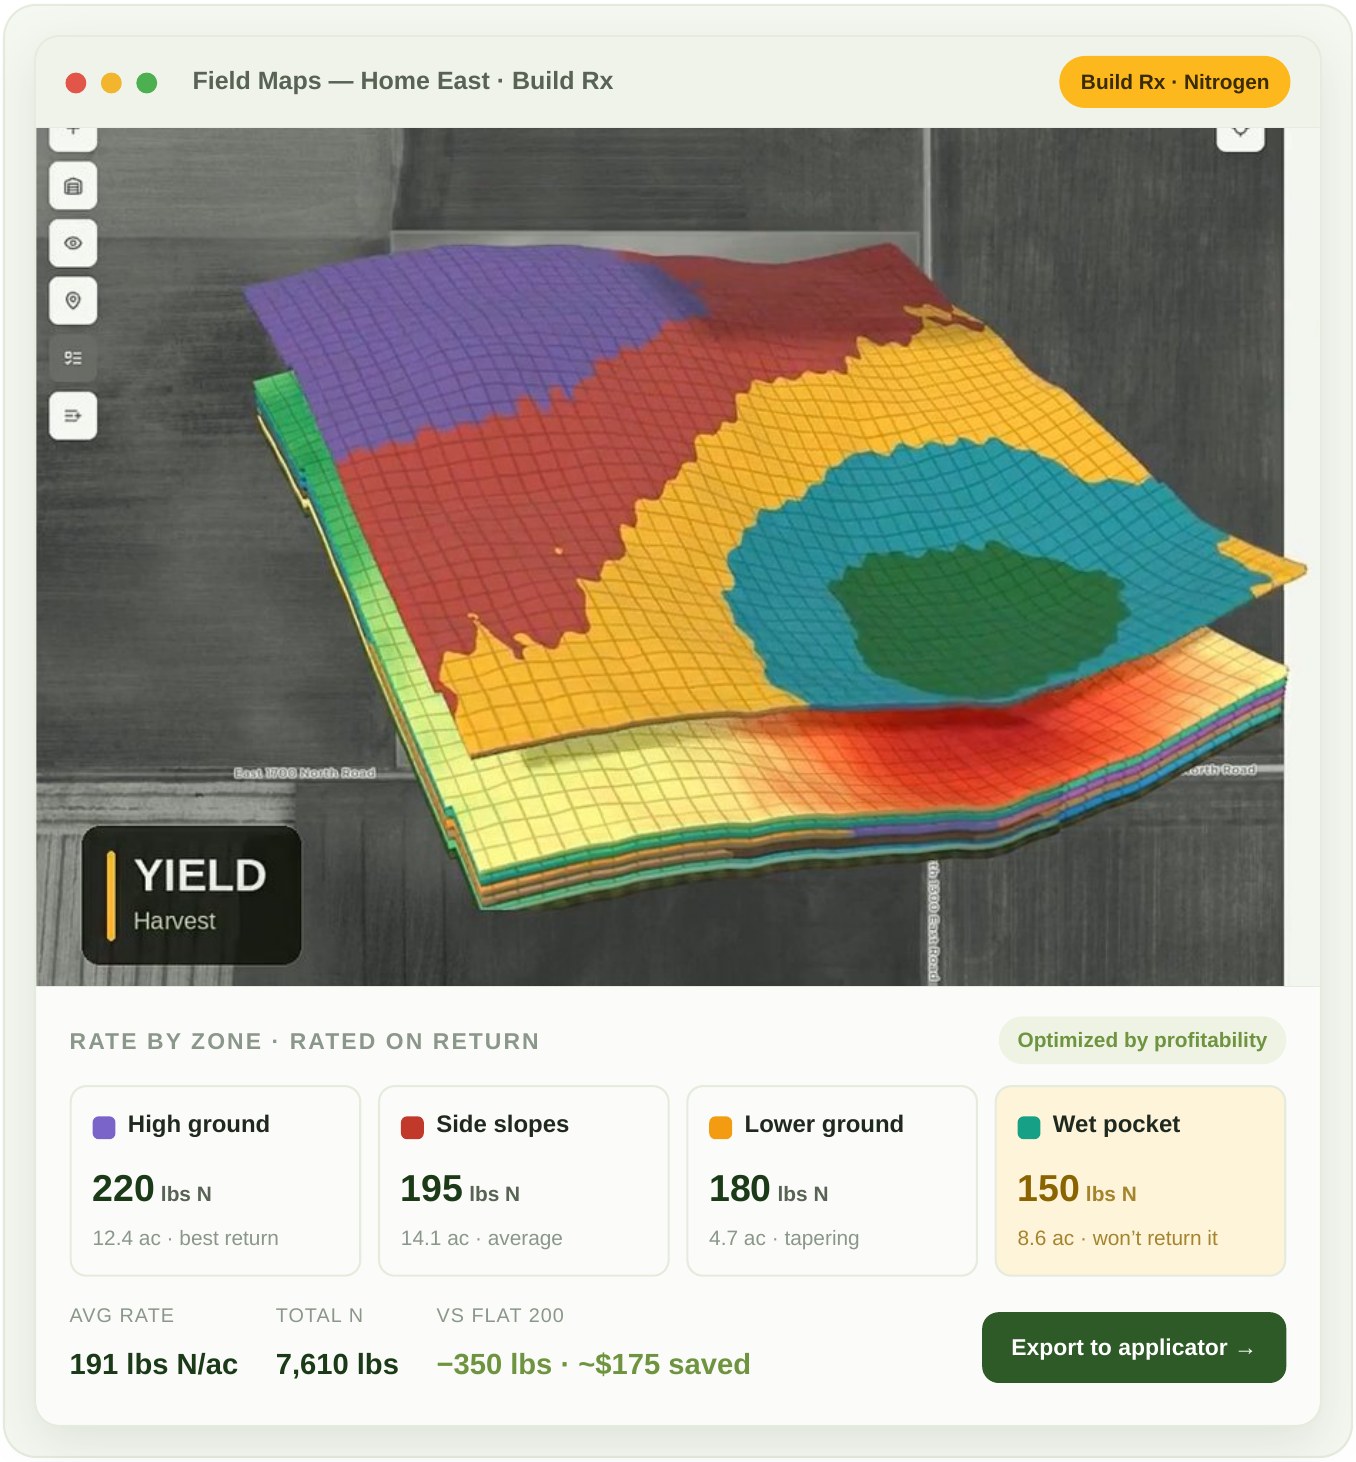
The field's own zones become the prescription: push nitrogen on the productive high ground, pull it back on the wet pocket that won't pay it back. Zones from real elevation and yield data; rates illustrative.
Step 4 — Optimize it, tune it, or send it for review
Here's where you decide how the prescription gets built, field by field. You have three paths:
Clevis Optimized (patent pending) lets the platform generate the optimized script for you, balancing yield potential and return across every zone. Custom factor weighting puts you in control of the recipe — dial up or down how much soil tests, profitability, wetness, and the other layers each count toward the rate. Send to your retailer hands the draft to your ag retailer or agronomist to review and adjust before it's generated. Whichever you pick, nothing is a black box — the reasoning behind every rate is visible, and you or your adviser can put eyes on it before a single script is written.
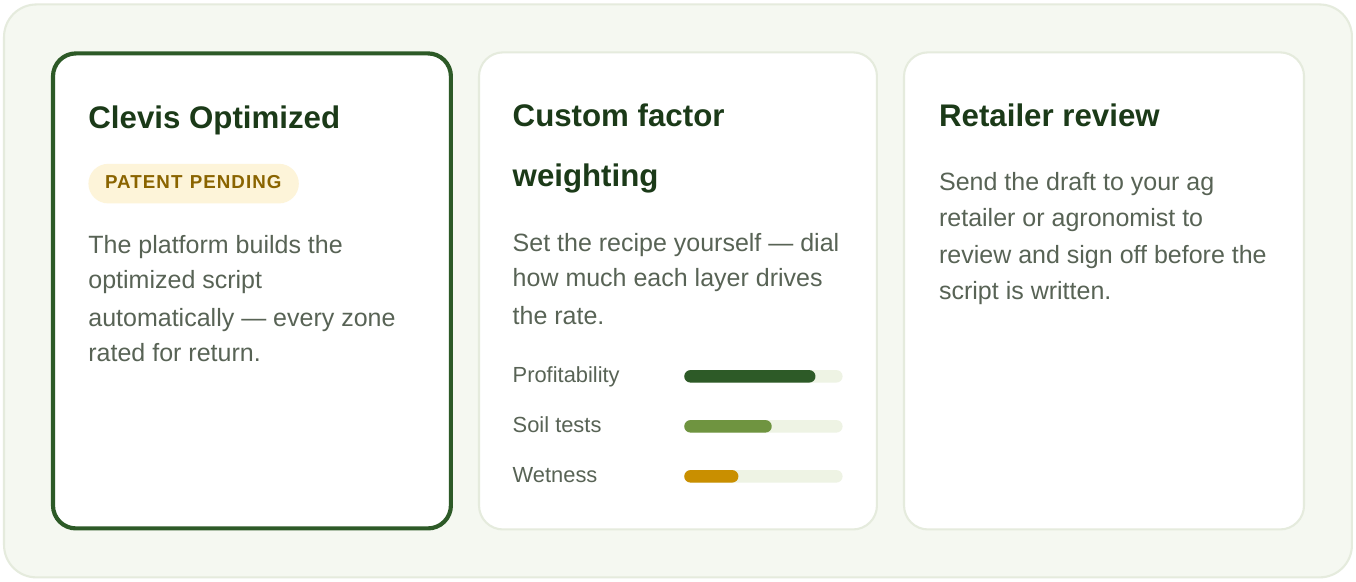
Three ways to build a prescription — auto-optimized, tuned to your own factor weights, or reviewed by your retailer first.
Step 5 — To the machine, and back again
When it's ready, the script exports straight to your planter or applicator: variable-rate, field-ready, no re-keying at the monitor. And it doesn't end at the field edge. This season's as-applied data and this fall's yield flow right back in, sharpening next year's zones. Each pass makes the next prescription a little smarter.
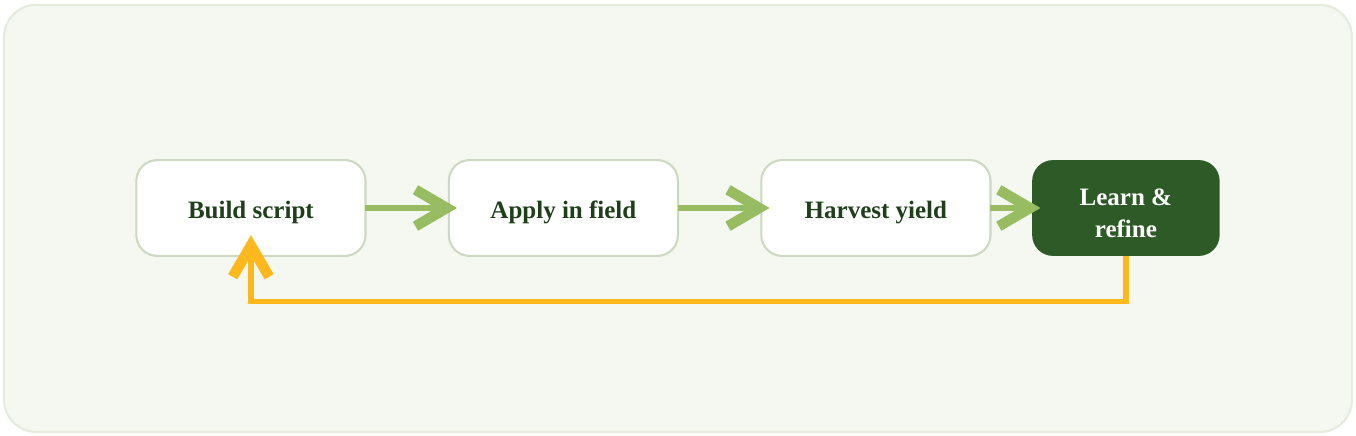
Every prescription is a loop, not a one-off — this year's harvest teaches next year's script.
The bottom line
Scripting isn't about applying less — it's about applying right. Match the input to the ground, rate it by what it returns, keep your agronomist in the loop, and let every harvest teach the next prescription. That's how a script stops being a guess and starts being a plan you can stand behind at the kitchen table.
See it on your own fields. Bring in your yield history and build your first prescription in minutes. Get started with Clevis →
This article is educational and not a substitute for site-specific agronomic advice. Example rates and figures are illustrative.
Keep reading
- Agronomy · 8 min read
In-Season Corn Decisions: The Calls That Make or Break the Crop
Corn makes its yield in a handful of narrow windows between emergence and grain fill — and most of those decisions get made in the truck, between everything else. Here's the in-season decision sequence that actually moves yield, and how an AI advisor grounded in your fields helps you catch each window on time.
Read - Agronomy · 5 min read
Will AI Replace Your Crop Consultant? An Honest Take
Short answer: no — and here's the part most people miss. Your agronomist is probably already using AI. So the real question isn't human vs. machine; it's what an AI grounded in your whole operation adds to the expertise you already trust.
Read - Accounting · 13 min read
Profit Per Acre: The Number That Tells You Which Fields Are Paying the Bills
A whole-farm P&L can look fine while a third of your acres quietly lose money. Here's how to actually compute profit per acre — field by field, with realized prices and land cost in — the three places the math usually goes wrong, and what to do once you can finally see it.
Read - Agronomy · 9 min read
In-Season Soybean Decisions: The Calls That Quietly Decide Your Bean Yield
Soybeans forgive more than corn — which is exactly why their in-season decisions get overlooked until they've already cost you. Here's the bean decision sequence that actually moves yield, and how an AI advisor grounded in your fields helps you catch each window before it closes.
Read